

Dashboards
A dashboard is a view made of number tiles and charts, arranged on a grid. Unlike every other view type it does not render rows of one database — it can measure several.
Two places a dashboard can live
Section titled “Two places a dashboard can live”- On a database — like any other view, in that database’s view bar.
- In a space — a dashboard that belongs to an area of work rather than to one table. This is the one to reach for when the numbers come from several databases.
You can move a database dashboard into its space. Tiles and charts that were implicitly measuring the view’s own database get that database written onto them as part of the move, so nothing comes out unconfigured. Only dashboards can move this way: every other view type renders rows of a database, so it has to stay on one.
Blocks: tiles and charts
Section titled “Blocks: tiles and charts”A tile is one number: a count, or the sum / average / min / max of a number field.
A chart is one series — bar, line, pie or grouped table. It groups records by a select/category/date field and aggregates each group.
Both are blocks, and both name their own source database and their own filter.
Where a block’s numbers come from
Section titled “Where a block’s numbers come from”- A block with no source of its own measures the view’s database. That is why every dashboard saved before per-block sources keeps working unchanged.
- A block with a source measures that database instead.
- Its own filter is ANDed with the view’s filter when the block is on the view’s own database. A block pointing at a different database is scoped by its own filter alone — the view’s filter names fields that only exist on the view’s database, so it cannot apply.
- On a space dashboard there is no view database, so a block with no source is unconfigured: it shows a picker rather than a number. Unconfigured is not broken, and nothing gets cleaned up behind your back.
Changing a block’s source clears its filter, group-by and measure
Section titled “Changing a block’s source clears its filter, group-by and measure”This is deliberate, and the app tells you when it happens. A filter, a group-by field and a measure field all refer to fields by name on the old database. Carried across to a new one they would silently refer to nothing — the block would keep rendering and quietly be wrong. Clearing them and saying so is the honest option, and you re-pick against the new source.
A source you cannot read
Section titled “A source you cannot read”If a block points at a database you do not have access to, it shows an explicit no-access state — not an empty chart and not a zero. “No access” and “nothing to count” are different answers, and rendering the second when the first is true is a lie a dashboard should never tell. One inaccessible block does not take down the rest of the dashboard.
Arranging a dashboard
Section titled “Arranging a dashboard”In edit mode:
- Drag the grip to reorder a block.
- Drag the corner to resize it.
The grid is 12 columns wide. A block’s width is 1–12 columns and its height is 1–6 rows, where a row is a tile’s natural height. Both persist per dashboard, for everyone who opens it — this is the dashboard’s layout, not your personal one.
Tiles and charts sit on one shared sequence, which is the point: a chart can sit beside the number it explains.
Two things worth knowing:
- You cannot leave a deliberate gap. Blocks flow in order and the grid packs them. This is a real limitation, accepted so that blocks can never overlap or land in an unreachable position.
- On a narrow screen every block becomes full width and spans are ignored. A 6-column block on a phone would otherwise be half a screen wide.
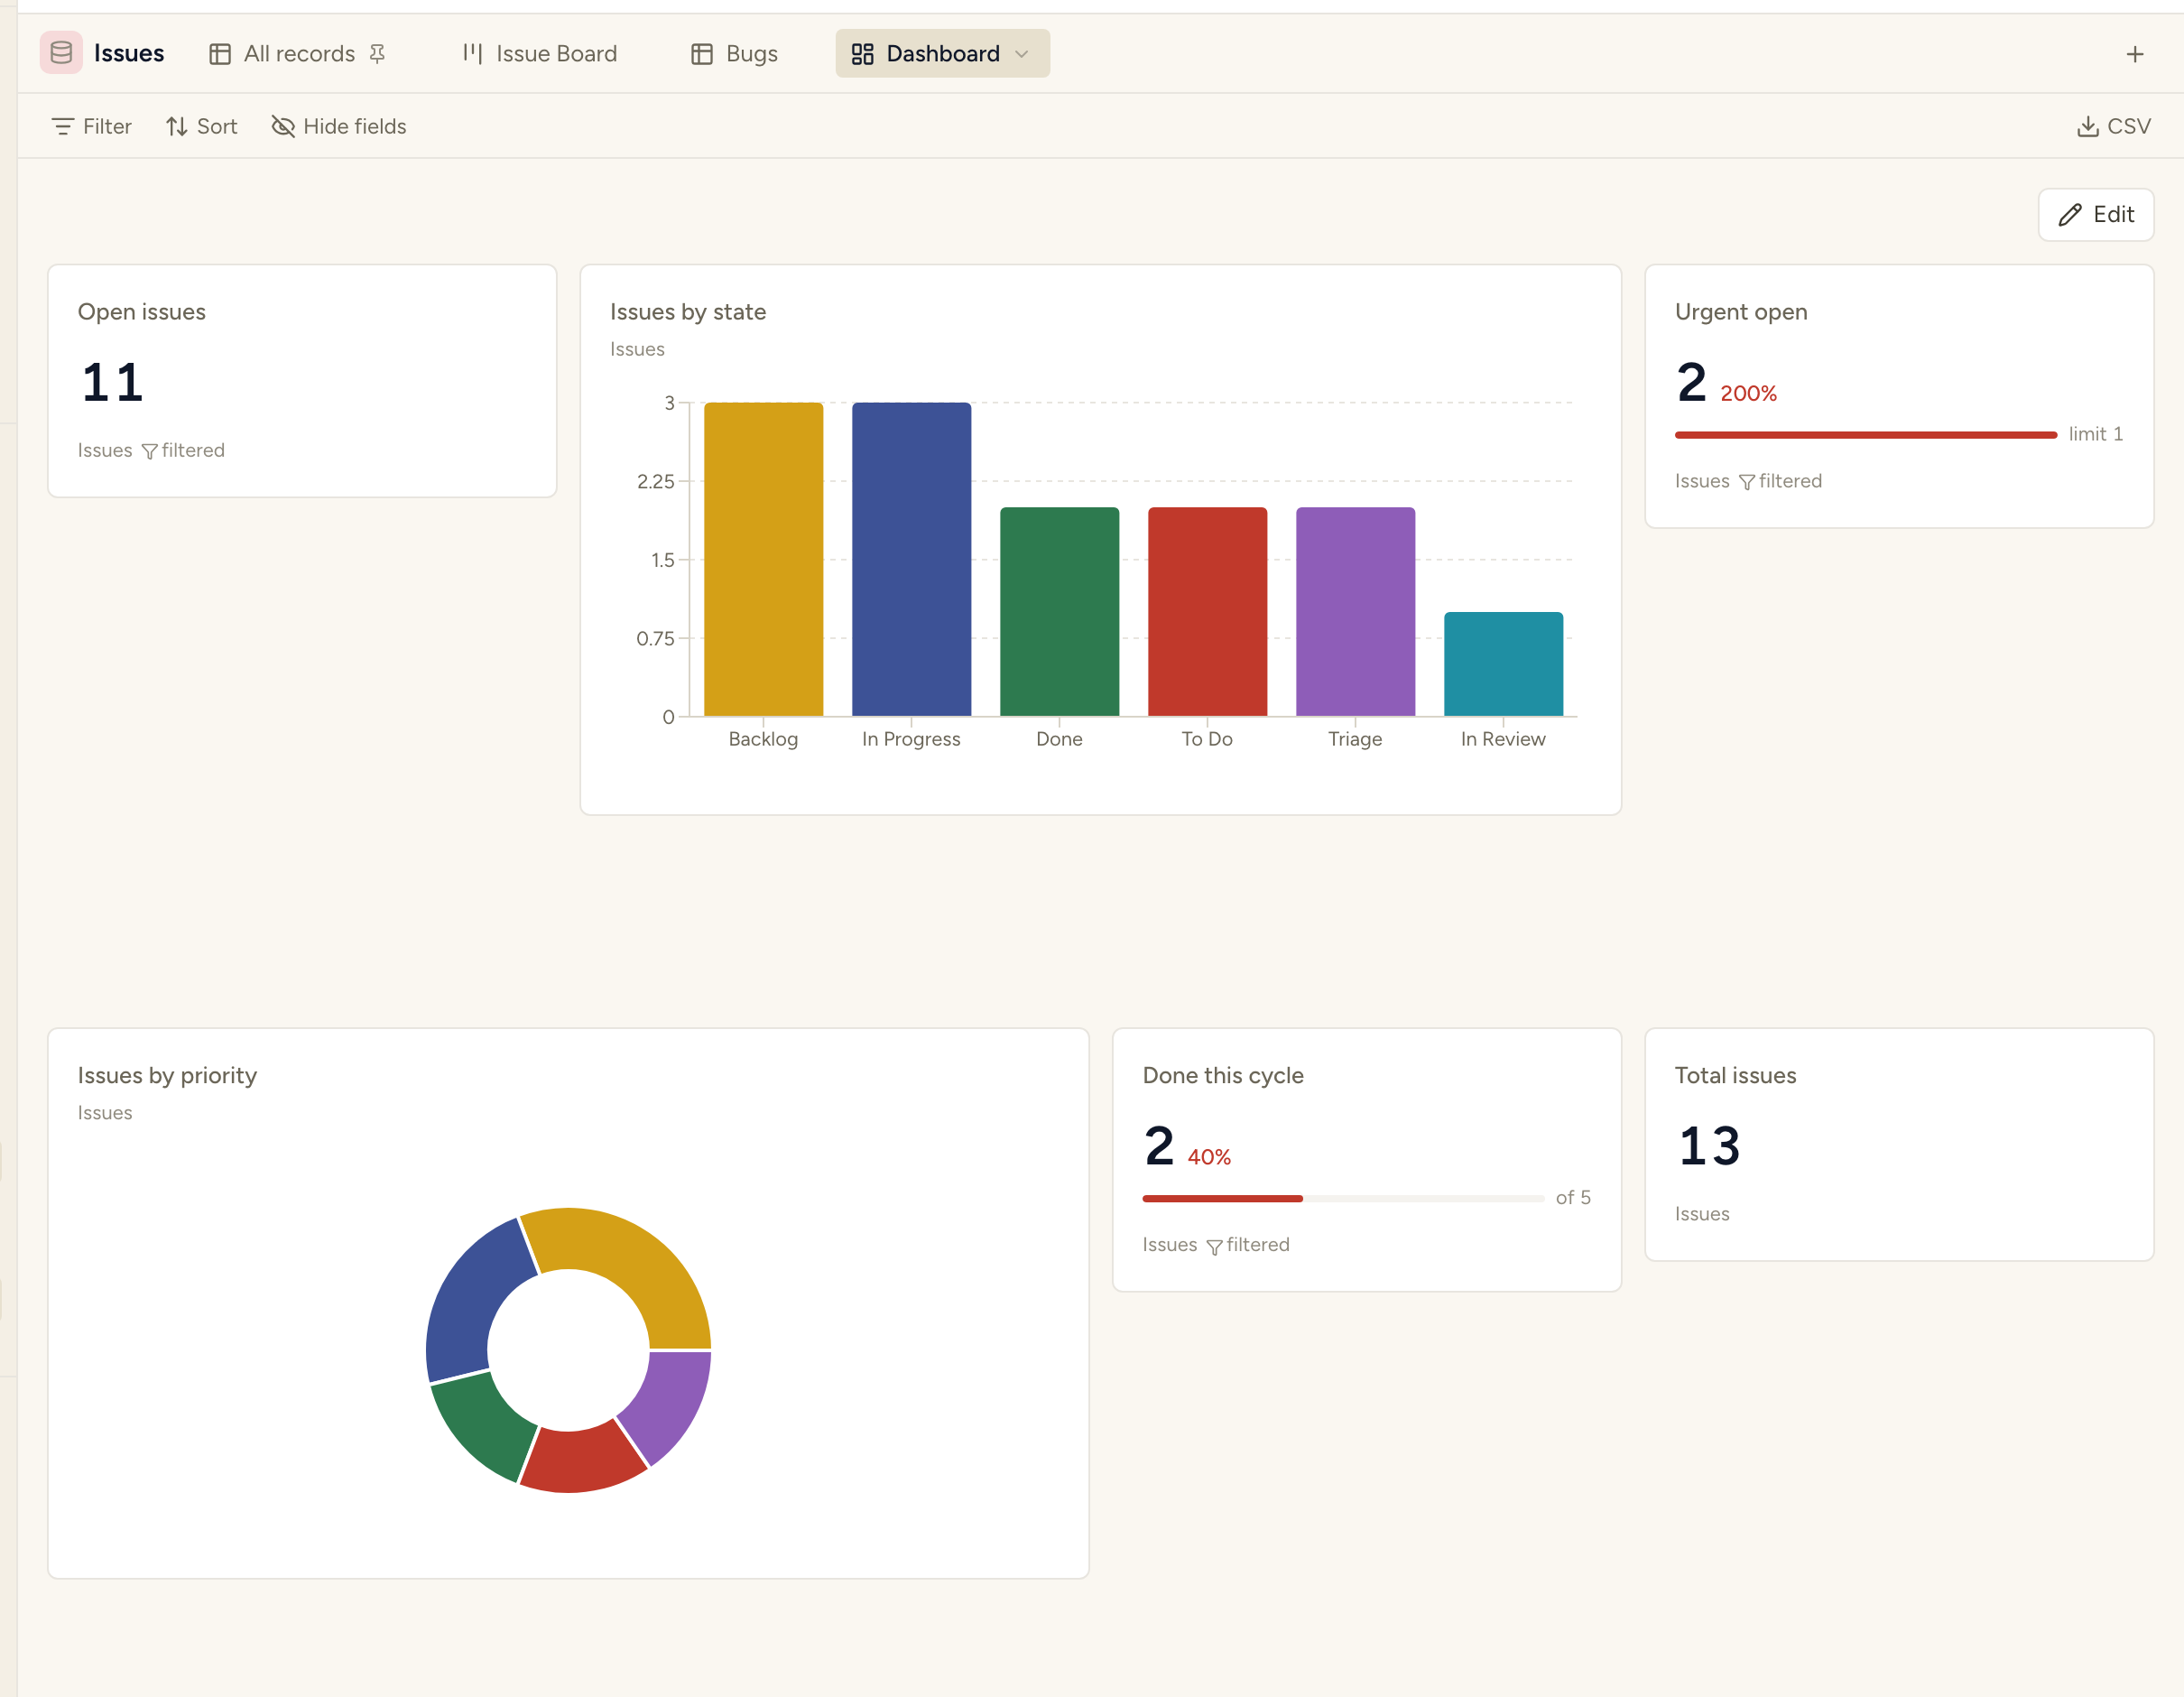
Giving a number a target
Section titled “Giving a number a target”“383” is not information. “383, against a target of 400” is.
A tile can carry a target and show progress against it. You also state the direction — whether higher is better, or whether the target is a limit — and that is a choice you make, never something the dashboard infers. More revenue is good; more overdue invoices is not.
- Higher is better: at or above the target reads as good.
- The target is a limit: below it reads as good, above it reads as bad.
The same numbers get opposite colours under opposite directions, which is exactly the point. A near miss reads neutral rather than alarming.
Going past a target shows the real number — 120% of target, not a capped 100% — while the progress bar itself stops at full, so an exceeded target cannot overflow its own bar.
When a tile deliberately shows no comparison at all
Section titled “When a tile deliberately shows no comparison at all”Three cases, and in every one the tile shows the number and nothing else:
- The value has not loaded yet. “0% of target” on a tile that simply has not finished counting is a lie with a progress bar attached.
- No target is set. Nothing to compare against.
- The target is zero. Every percentage against zero is infinite, and “∞% of target” stated confidently on a dashboard is worse than silence.
Renaming and deleting
Section titled “Renaming and deleting”Every dashboard and every folder in the sidebar has a ⋯ menu with Rename and Delete, wherever you have edit access.
- Deleting a dashboard removes its tiles and charts. The records they measured are not touched — a dashboard only ever reads.
- A database’s views keep the last-one rule: a database must always have at least one view, so its final view cannot be deleted. Space-level dashboards have no such rule — a space can have none.
If you try to delete a database-owned view through the space route, it refuses and tells you to delete it through its database, which is where the keep-one rule is enforced.